Dashboards
Turn a business question into a saved view that is easy to check again.
In one sentence
Dashboards turn a conversation about your numbers into a saved, shareable view.
Use it when
Use a dashboard when the same group of questions matters every day or every week. Good examples are collections at risk, sales by region, stock that is not moving, and the owner view for Monday morning.
Do not build a dashboard for a question you will ask once. Use Chat for that.
Build one
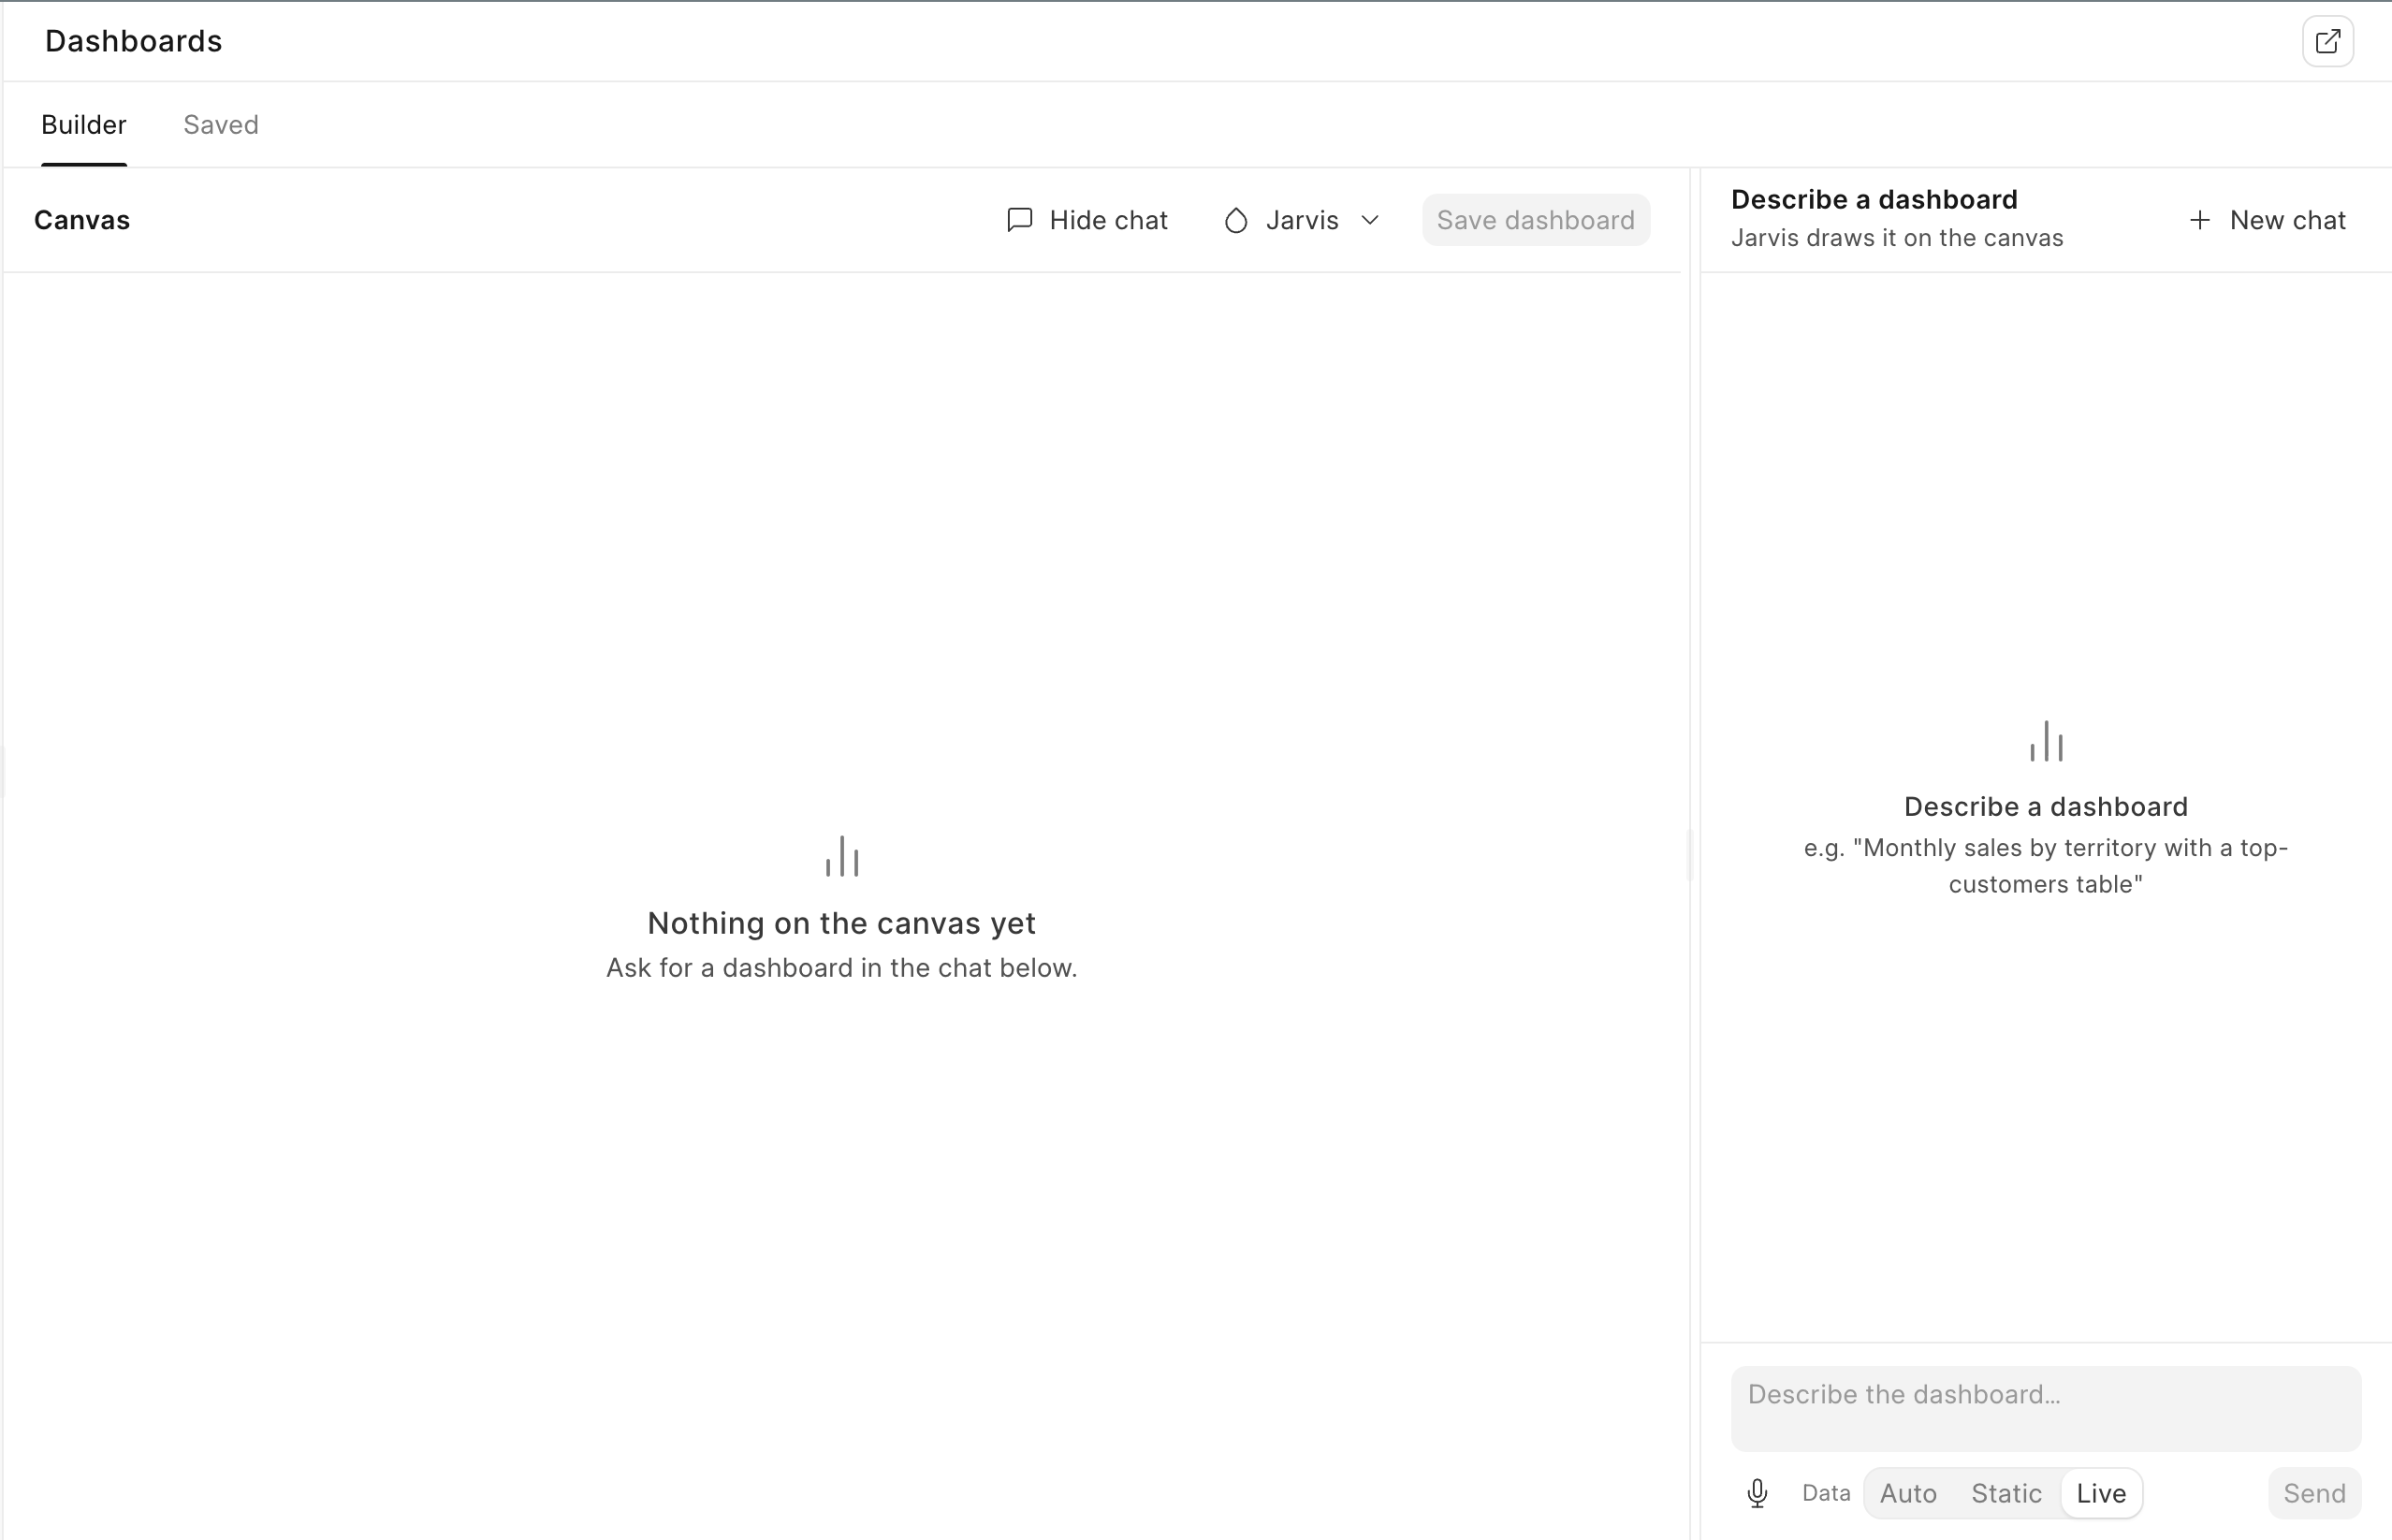
- Open More, then Dashboards.
- In the Builder, describe the decision the dashboard should support.
- Name the period, company, measures, and useful comparisons.
- Choose a restrained theme that keeps the measures easy to compare.
- Check the generated view and every detected source against the source records.
- Save it with a name the intended reader will recognise.
You can also open dashboard output from a Chat in the dashboard workspace and continue from there.
Save, share, and continue
The Saved tab holds views you can open again. A saved dashboard keeps its detected sources and owner. Choose Private, a named Role, or Everyone for visibility. Sharing a dashboard never gives a viewer access to source data they could not already read.
Open a saved dashboard to discuss it, continue editing, or return to the Builder. Export PNG for a fixed image or PDF for a document, but remember that exports do not update when the records change. Delete only when the saved view and its discussion are no longer needed.
A real example
Every Monday, an owner asks three questions: sales booked last week, collections expected this week, and stock below reorder level. Instead of opening three reports, the owner saves one dashboard with those three views and shares it with the finance and purchasing leads.
A clear chart can still contain a wrong choice of date, company, or measure. Compare the first result with the source report before making the dashboard part of a routine.
Try a realistic task
Follow Build a weekly owner dashboard.